Richest Cities in California (2026)
by Kristen Carney
Updated: February 9, 2026
Richest City in California
The richest city in California is Atherton with an average household income of $580,438 as of 2024 and 6,993 people as of 2024 according to the most current Census data available (citation).
| Rank | City | County | Population | Average Income | Median Income |
|---|---|---|---|---|---|
| 1 | Atherton | San Mateo | 6,993 | $580,438 | $250,001 |
| 2 | Norris Canyon | Contra Costa | 1,014 | $579,551 | $250,001 |
| 3 | Shell Ridge | Contra Costa | 746 | $560,640 | $250,001 |
| 4 | Hillsborough | San Mateo | 11,099 | $546,056 | $250,001 |
| 5 | Ross | Marin | 2,606 | $536,025 | $250,001 |
| 6 | Monte Sereno | Santa Clara | 3,461 | $483,116 | $250,001 |
| 7 | Belvedere | Marin | 2,345 | $476,762 | $250,001 |
| 8 | Rolling Hills city | Los Angeles | 1,509 | $471,345 | $250,001 |
| 9 | Woodside | San Mateo | 5,126 | $465,902 | $250,001 |
| 10 | Portola Valley | San Mateo | 4,305 | $464,109 | $250,001 |
| 11 | West Menlo Park | San Mateo | 3,634 | $461,728 | $250,001 |
| 12 | Dillon Beach | Marin | 293 | $453,250 | $209,536 |
| 13 | Los Altos Hills | Santa Clara | 8,377 | $450,307 | $250,001 |
| 14 | Emerald Lake Hills | San Mateo | 4,235 | $440,044 | $250,001 |
| 15 | Sleepy Hollow | Marin | 3,063 | $425,817 | $250,001 |
| 16 | Lake Sherwood | Ventura | 1,633 | $424,825 | $234,020 |
| 17 | Ladera | San Mateo | 1,297 | $418,102 | $235,750 |
| 18 | Hidden Hills | Los Angeles | 2,150 | $417,850 | $250,001 |
| 19 | Los Altos | Santa Clara | 30,698 | $417,182 | $250,001 |
| 20 | Piedmont | Alameda | 10,945 | $410,345 | $250,001 |
Median Income versus Average Income: Which Should You Use?
We usually suggest using median income data – either instead of or in addition to – average income data as a true indicator of wealth. If you haven’t thought about median versus average since your last standardized test, you aren’t alone. Here’s what they are:
- average is the sum of a set of numbers divided by the count of numbers in the set
- median is the middle number in the set of numbers
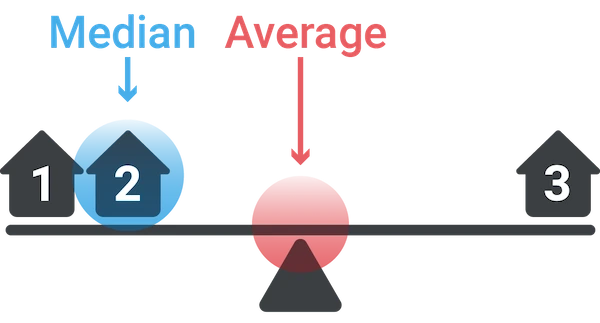
Now let’s say you had the following simplified set of income data.
Household 1: $30,000
Household 2: $50,000
Household 3: $1,000,000
The average income for this set is $360,000. The outlier data point ($1,000,000) skews the average WAY up. Conversely, the average income would be skewed WAY down if someone had an income of $500. The median income for the same data set is $50,000. Outlier data doesn’t skew the median.
Most Business Owners Should Use Median Income
So most business owners should use the median income as a true indicator of wealth, because it provides a more accurate representation of a typical income, especially in areas with significant income disparity.
When Should You Use Average Income
If your target market is high-income households, the average income may be more relevant. This is because the average income can highlight the presence of a higher concentration of wealthy individuals, which is beneficial for luxury goods and services marketing. We’re using average income on this page because using the Census’s highest reported median value of $250,001 could result in multiple ties for the richest geography.
Why do so many cities have a median value of $250,001?
The Census' American Community Survey uses $250,000+ as a jam value for median income estimates to protect privacy, ensure data consistency, and simplify reporting. A "jam value" in survey data refers to a placeholder or default value used when actual data points are unavailable, incomplete, or exceed certain thresholds. We represent this jam value as $250,001 to make it easy for you to sort.
You might also be interested in:
Email Me When New Data Are Released
Join thousands of subscribers and receive just 1 (ONE!) email a year in December when the US Census Bureau releases new income data for California richest cities.
SOURCES
United States Census Bureau. Annual Estimates of the Resident Population: April 1, 2020 to July 1, 2023. U.S. Census Bureau, Population Division. Web. May 2024. http://www.census.gov/.
United States Census Bureau. B01001 SEX BY AGE, 2024 American Community Survey 5-Year Estimates. U.S. Census Bureau, American Community Survey Office. Web. 29 January 2026. http://www.census.gov/.
United States Census Bureau. B19013 Median Household Income, 2024 American Community Survey 5-Year Estimates. U.S. Census Bureau, American Community Survey Office. Web. 29 January 2026. http://www.census.gov/.
United States Census Bureau. "DP03 SELECTED ECONOMIC CHARACTERISTICS." 2024 American Community Survey 5-Year Estimates. U.S. Census Bureau, American Community Survey Office. Web. 29 January 2026. http://www.census.gov/.
Products & Services
Plumbing
Connect
- 1-800-939-2130
- Contact Us
© Copyright 2026 Cubit Planning, Inc.